Communications Module (OPC UA Clients)
🔌 Connect to Industrial Systems
The Communications Module focuses on the configuration and management of OPC UA Clients that connect to external OPC UA servers. OPC UA (Open Platform Communications Unified Architecture) is the industry standard for secure and reliable data exchange in industrial automation.
This module allows PyAutomation to act as an OPC UA client, connecting to remote OPC UA servers to browse their address spaces, select variables, and monitor real-time data from industrial equipment, SCADA systems, and other automation devices.
Overview
The OPC UA Clients interface is divided into two main sections:
- Client Configuration and Tag Monitoring: Manage OPC UA client connections and view monitored tags
- OPC UA Explorer: Browse the address space of connected OPC UA servers
Creating an OPC UA Client
To establish a connection to an external OPC UA server, you need to create a new client configuration.
1. Access the Client Configuration
Navigate to Communications → OPC UA Clients from the main menu. The client configuration section is located at the top of the interface.
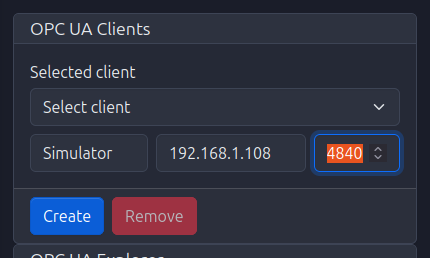
2. Configure Client Parameters
In the Selected client section, provide the following information:
- Name: A descriptive name for the client connection (e.g., "Simulator", "PLC_Production_Line_1")
- Server Address: The IP address or hostname of the OPC UA server (e.g.,
192.168.1.108,127.0.0.1) - Port: The network port where the OPC UA server is listening (default:
4840)
3. Create the Client
- Fill in the Name, Server Address, and Port fields with valid values
- Click the Create button (blue button) to establish the client connection
- The client will appear in the dropdown menu under Selected client
4. Select Existing Client
To work with an existing client:
- Click on the Selected client dropdown
- Choose the desired client from the list
- The client's configuration will be loaded and displayed in the input fields
5. Remove a Client
To delete a client configuration:
- Select the client from the dropdown
- Click the Remove button (red button)
- Confirm the removal when prompted
Exploring OPC UA Server Address Space
The OPC UA Explorer section allows you to browse the complete address space of the connected OPC UA server, including all objects, variables, and their hierarchical structure.
Accessing the Explorer
Once a client is selected and connected, the OPC UA Explorer will display the server's address space in a tree structure below the client configuration area.
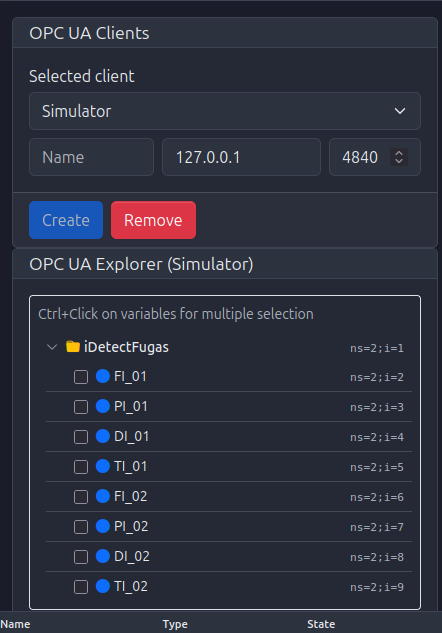
Navigating the Tree
- Expand/Collapse Nodes: Click on folder icons or expand arrows to navigate through the hierarchical structure
- Node Information: Each node displays:
- A checkbox for selection
- An icon indicating the node type (variables typically show colored circles)
- The Display Name of the node
- The Node ID in the format
ns=<namespace>;i=<identifier>(e.g.,ns=2;i=2)
Selecting Variables for Monitoring
Single Selection
To select a single variable:
- Click on the checkbox next to the variable name
- The selected variable will be highlighted
Multiple Selection
To select multiple variables:
- Hold Ctrl (or Cmd on Mac) and click on the checkboxes of the variables you want to monitor
- Selected variables will be highlighted with a different background color
- The selection count is displayed next to the "Clear selection" button
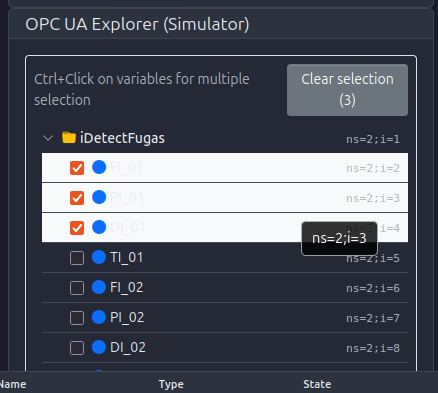
Clear Selection
To deselect all selected variables:
- Click the Clear selection button (showing the count of selected items)
- All checkboxes will be unchecked
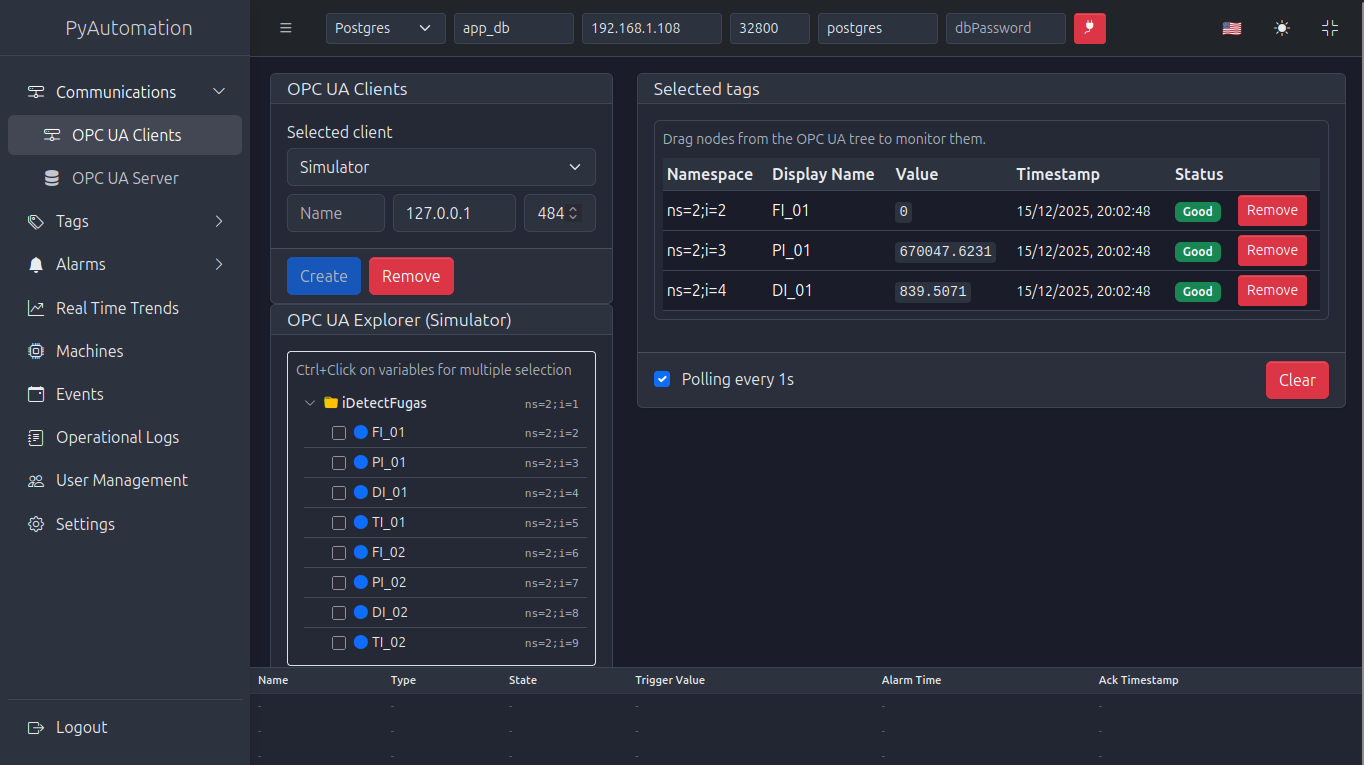
Monitoring Selected Tags
Once you have selected variables from the OPC UA Explorer, they appear in the Selected tags section for real-time monitoring.
Adding Tags to Monitor
Method 1: Drag and Drop
- Drag nodes from the OPC UA Explorer tree to the Selected tags area
- Dropped variables will automatically appear in the monitoring table
Method 2: Checkbox Selection (if implemented)
- Check variables in the explorer and use an "Add to Monitor" action
Tag Monitoring Table
The Selected tags table displays the following information for each monitored tag:
- Namespace: The Node ID namespace and identifier (e.g.,
ns=2;i=2) - Display Name: The friendly name of the variable (e.g.,
FI_01,PI_01) - Value: The current value of the variable (updated in real-time)
- Timestamp: The last update time in format
DD/MM/YYYY, HH:MM:SS - Status:
- Green "Good" indicator when the connection and value are valid
- Error indicators if the connection fails or value is invalid
- Actions: Red "Remove" button to stop monitoring a specific tag
Polling Configuration
Below the tag monitoring table, you can configure the polling frequency:
- Polling every Xs: Check this option and adjust the interval (default: 1 second)
- When enabled, the client will periodically read values from the OPC UA server at the specified interval
- Uncheck to disable automatic polling
Clearing Monitored Tags
- Click the Clear button (red button) to remove all tags from the monitoring table
- This action stops monitoring all currently selected tags but does not disconnect the client
Best Practices
- Connection Management: Ensure the OPC UA server is accessible on the network before creating a client
- Network Configuration: Verify firewall settings allow connections on the specified port
- Tag Selection: Select only the tags you need to monitor to optimize performance and network bandwidth
- Polling Frequency: Adjust polling intervals based on your data update requirements and network capacity
- Naming Conventions: Use descriptive names for clients to easily identify different server connections
Security Notes
Note: Currently, OPC UA client connections do not support security policies and authentication. All connections are established in unsecured mode. Security features will be available in future releases.