Real-Time Trends Module
📊 Live Process Visualization
The Real-Time Trends Module provides a powerful visualization interface for monitoring process variables in real-time using configurable strip charts. This module enables operators and engineers to create custom dashboards with multiple charts displaying live data from selected tags.
What are Real-Time Trends?
Real-Time Trends (also called Strip Charts) are graphical displays that show the continuous evolution of tag values over time. Unlike historical trends that show past data, real-time trends display live, streaming data that updates continuously as new values arrive.
Key Features
- Multiple Strip Charts: Create and configure multiple independent charts on a single dashboard
- Edit and Production Modes: Switch between configuration mode and locked visualization mode
- Drag and Resize: Reposition and resize charts to create custom layouts
- Multiple Tags Per Chart: Display multiple tags on a single chart with automatic unit grouping
- Configurable Buffer Size: Control how much historical data each chart retains
- Persistent Layouts: Chart configurations and positions are saved automatically
Module Overview
The Real-Time Trends interface provides a flexible canvas where you can:
- Create multiple strip charts
- Configure which tags appear on each chart
- Arrange charts in a custom layout
- Switch between edit mode (for configuration) and production mode (for viewing)
Accessing Real-Time Trends
- Navigate to Real-Time Trends from the main menu
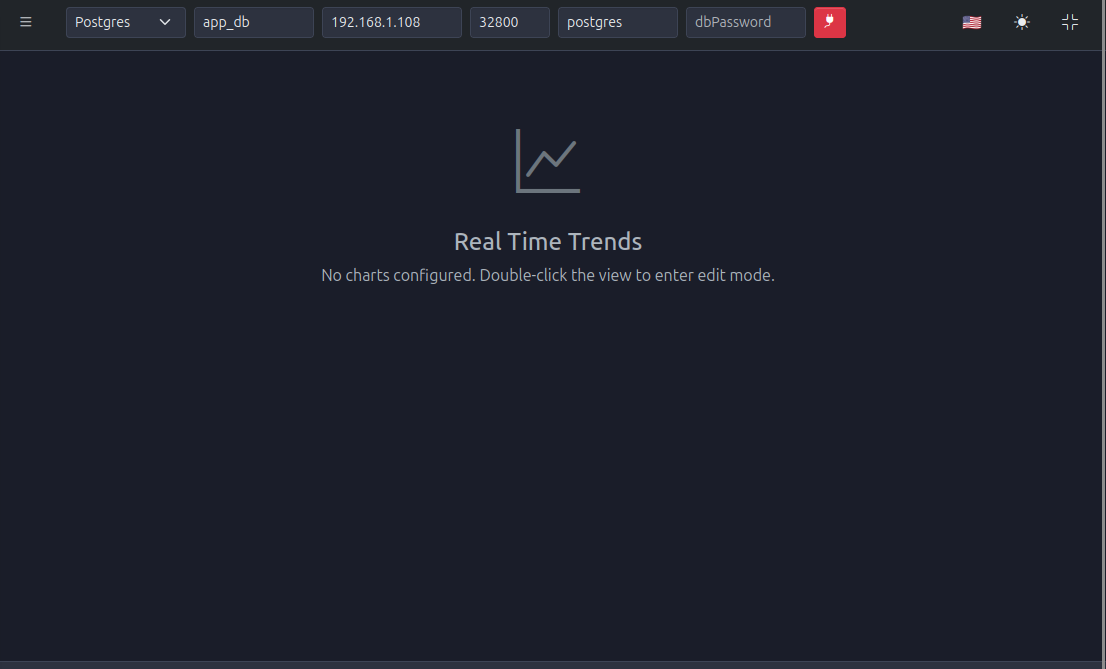
- The page opens in Production Mode by default (if charts exist) or Edit Mode (if empty)
- Double-click anywhere on the page to toggle between Edit and Production modes
Understanding Modes
Edit Mode
In Edit Mode, you can:
- Add new strip charts
- Configure chart properties (title, tags, buffer size)
- Drag charts to reposition them
- Resize charts by dragging corners or edges
- Delete charts
- Modify tag selections
Visual Indicators: * Charts show resize handles and drag handles * Configuration buttons are visible * Delete buttons appear on each chart
Production Mode
In Production Mode:
- Layout is locked (no dragging or resizing)
- Charts display live data only
- Configuration options are hidden
- Focus is on visualization
Visual Indicators: * No resize or drag handles * Clean, uncluttered display * Full-screen viewing experience
Creating a Strip Chart
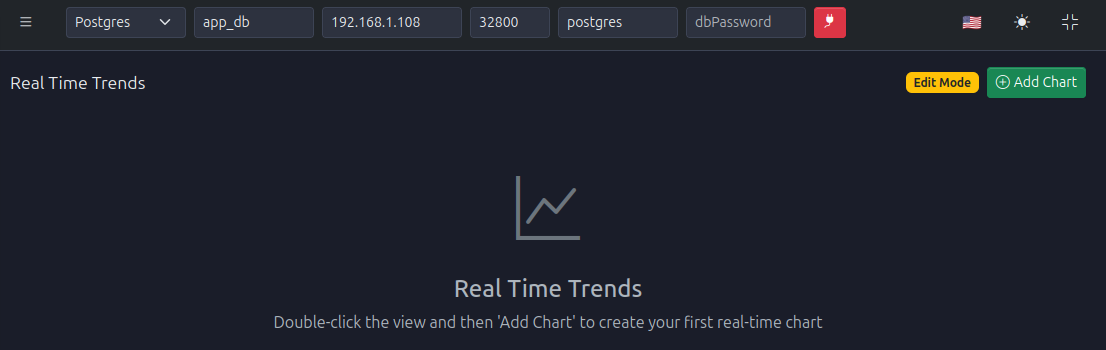
Step 1: Enter Edit Mode
- Double-click anywhere on the Real-Time Trends page
- The interface switches to Edit Mode
- You'll see an "Add Chart" button or similar control
Step 2: Add a New Chart
- Click the Add Chart button
- A new strip chart appears on the canvas with default settings
- The chart will have a default title (e.g., "Chart 1")
Step 3: Configure Chart Properties
Each chart has several configurable properties:
Title
- Purpose: Descriptive name for the chart
- Location: Typically displayed at the top of the chart
- Best Practice: Use descriptive names like "Reactor Temperature", "Pressure Monitoring", etc.
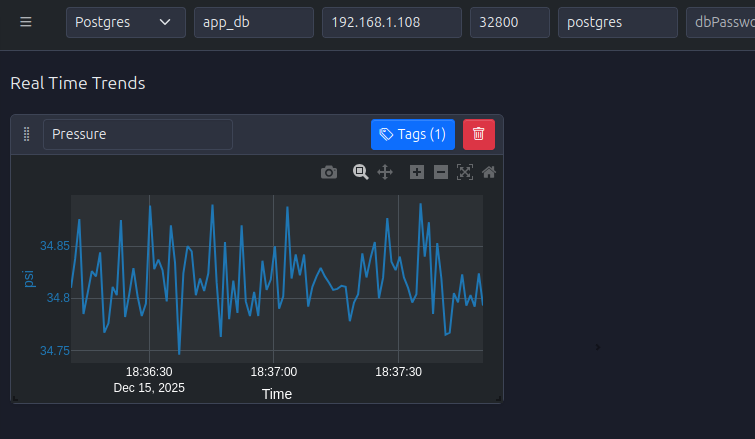
Tags Selection
- Purpose: Select which tags to display on the chart
- Multiple Tags: You can add multiple tags to a single chart
- Unit Grouping: Tags with the same unit are automatically grouped on the same Y-axis
- Multiple Units: Up to two different units can be displayed (using dual Y-axes)
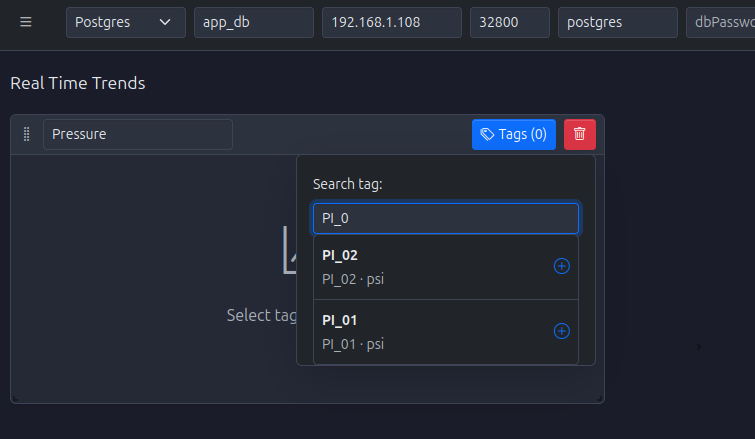
To Add Tags:
- Click the Tags button or configuration icon on the chart
- A tag selection dialog opens
- Search for tags by name
- Select tags from the list
- Click Add or Confirm to add them to the chart
Buffer Size
- Purpose: Controls how many data points are retained in memory
- Range: Typically 50 to 1000+ points
- Impact:
- Larger buffers show longer history but use more memory
- Smaller buffers show shorter history but are more memory-efficient
- Recommendation: Use 100-200 points for most applications
Step 4: Arrange Charts
In Edit Mode, you can arrange charts to create your custom layout:
Repositioning Charts
- Drag: Click and hold on a chart, then drag it to a new position
- Grid Snapping: Charts snap to a grid for alignment
- Overlap Prevention: The system prevents charts from overlapping
Resizing Charts
- Resize Handles: Click and drag the corners or edges of a chart
- Minimum Size: Charts have a minimum size to ensure readability
- Aspect Ratio: Maintain appropriate aspect ratios for best visualization
Step 5: Save Configuration
- Automatic Saving: Chart configurations are automatically saved to browser localStorage
- Persistence: Your layout persists across browser sessions
- No Manual Save: No need to click a save button; changes are saved immediately
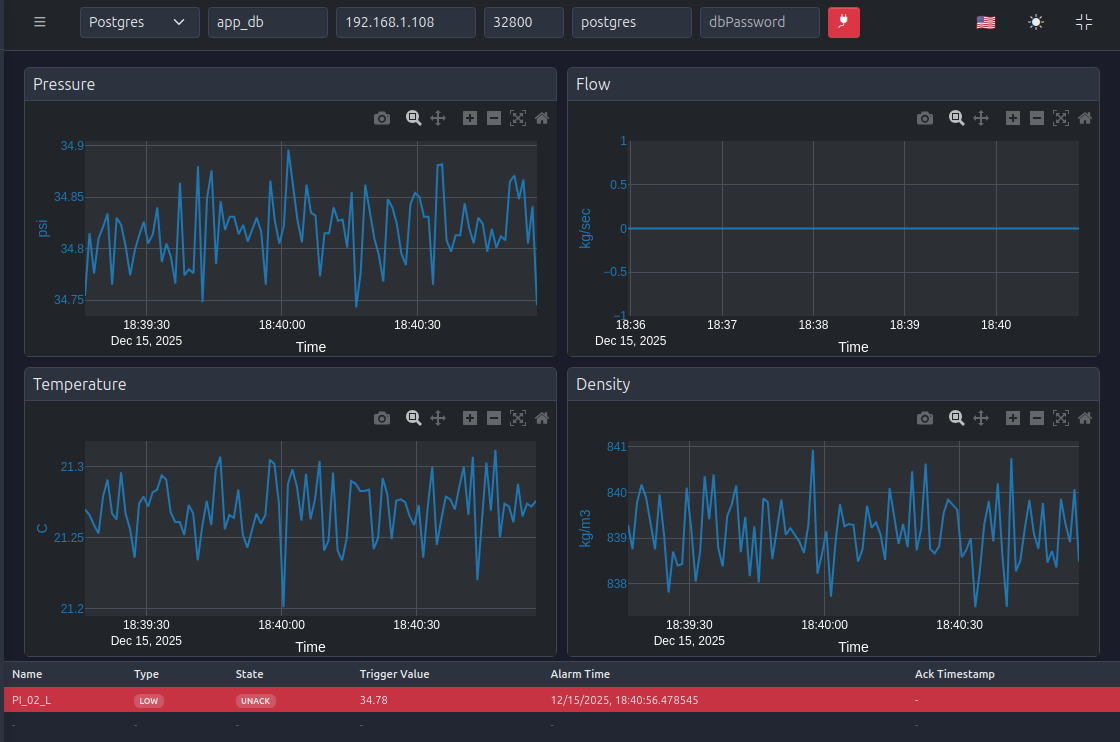
Configuring Multiple Charts
You can create a comprehensive dashboard with multiple charts:
Best Practices for Layout
- Group Related Variables: Place related tags on the same chart or adjacent charts
- Logical Arrangement: Arrange charts in a logical flow (e.g., upstream to downstream)
- Size Appropriately: Make critical charts larger, less critical ones smaller
- Avoid Clutter: Don't overcrowd the dashboard; use multiple pages if needed
Tag Organization
- Same Unit Grouping: Tags with the same unit automatically share a Y-axis
- Dual Y-Axes: When tags have different units, the chart automatically creates dual Y-axes
- Color Coding: Each tag is displayed in a different color for easy identification
- Legend: Charts include legends showing tag names and colors
Managing Charts
Editing Chart Configuration
To modify an existing chart:
- Enter Edit Mode (double-click)
- Click on the chart you want to edit
- Access configuration options (Tags button, Settings icon, etc.)
- Modify title, tags, or buffer size as needed
- Changes are saved automatically
Deleting Charts
To remove a chart:
- Enter Edit Mode
- Locate the delete button (typically an X icon) on the chart
- Click the delete button
- Confirm deletion if prompted
- The chart is removed from the layout
Understanding Buffer Size
The buffer size determines how much historical data each chart displays:
How It Works
- FIFO Buffer: New values are added, oldest values are removed when buffer is full
- Time Window: The visible time window depends on buffer size and tag scan time
- Example: With buffer size 100 and scan time 1 second, you see the last 100 seconds of data
Choosing Buffer Size
-
Small Buffer (50-100):
- Short-term trends
- Fast-changing variables
- Lower memory usage
-
Medium Buffer (100-200):
- General purpose monitoring
- Balanced history and performance
- Recommended for most applications
-
Large Buffer (200-500+):
- Long-term trend analysis
- Slow-changing variables
- Higher memory usage
Advanced Features
Multiple Units on One Chart
When tags with different units are added to the same chart:
- Automatic Y-Axis Creation: The system creates dual Y-axes
- Left Y-Axis: First unit group
- Right Y-Axis: Second unit group
- Color Coding: Each unit group uses distinct colors
- Legend: Clearly indicates which tags use which axis
Real-Time Updates
- Update Frequency: Charts update as new tag values arrive
- Smooth Scrolling: Older data scrolls left as new data appears on the right
- Performance: Updates are optimized for smooth visualization
Best Practices
Chart Configuration
- Descriptive Titles: Use clear, descriptive chart titles
- Logical Tag Grouping: Group related tags together
- Appropriate Buffer Sizes: Match buffer size to your monitoring needs
- Consistent Layout: Maintain consistent layouts across dashboards
Layout Design
- Critical First: Place most critical charts at the top or in prominent positions
- Logical Flow: Arrange charts to follow process flow
- Adequate Sizing: Ensure charts are large enough to read values easily
- Balance: Don't make all charts the same size; emphasize important ones
Performance
- Limit Tags Per Chart: Don't overload charts with too many tags (recommended: 2-5 tags per chart)
- Reasonable Buffer Sizes: Very large buffers can impact performance
- Chart Count: Limit the total number of charts for optimal performance
Troubleshooting
Charts Not Displaying Data
If charts show no data:
- Verify Tags: Ensure selected tags are active and receiving data
- Check Tag Configuration: Verify tags have proper scan times configured
- Review Buffer Size: Ensure buffer size is appropriate
- Check Mode: Confirm you're in Production Mode for viewing
Layout Not Saving
If chart positions don't persist:
- Browser Storage: Check that browser localStorage is enabled
- Clear Cache: Try clearing browser cache and reconfiguring
- Browser Compatibility: Ensure you're using a supported browser
Performance Issues
If the interface is slow:
- Reduce Buffer Sizes: Lower buffer sizes for charts
- Fewer Tags: Reduce the number of tags per chart
- Fewer Charts: Limit the total number of charts
- Browser: Close other browser tabs to free resources
Integration with Other Modules
Real-Time Trends integrates with:
- Tags Module: Displays data from configured tags
- Communications Module: Shows data from OPC UA client connections
- Database Module: Historical data can be viewed in Trends module (different from Real-Time Trends)
Getting Started
To begin using Real-Time Trends:
-
Access the Module:
- Navigate to Real-Time Trends from the main menu
-
Enter Edit Mode:
- Double-click on the page to enter Edit Mode
-
Create Your First Chart:
- Click "Add Chart"
- Configure title, select tags, set buffer size
- Position and resize the chart
-
Add More Charts:
- Create additional charts as needed
- Arrange them in your preferred layout
-
Switch to Production Mode:
- Double-click to exit Edit Mode
- Enjoy your real-time monitoring dashboard
-
Refine Your Layout:
- Return to Edit Mode as needed to adjust charts
- Add or remove tags, modify buffer sizes, rearrange layout