Quick Start: Running PyAutomation with HMI using Docker
🚀 From Zero to Production in Minutes
Complete Docker Deployment Guide for PyAutomation 2.0.0
This Quick Start guide walks you through bringing up a fully functional PyAutomation instance (backend + HMI) using Docker, and performing the minimum configuration needed to operate the system end‑to‑end.
It is aimed at engineers and operators who want to go from zero to a working system as quickly as possible, while still following production‑grade practices.
📌 Note
Throughout this guide we assume you are working on a single host (your laptop or a server) and have Docker and Docker Compose installed.
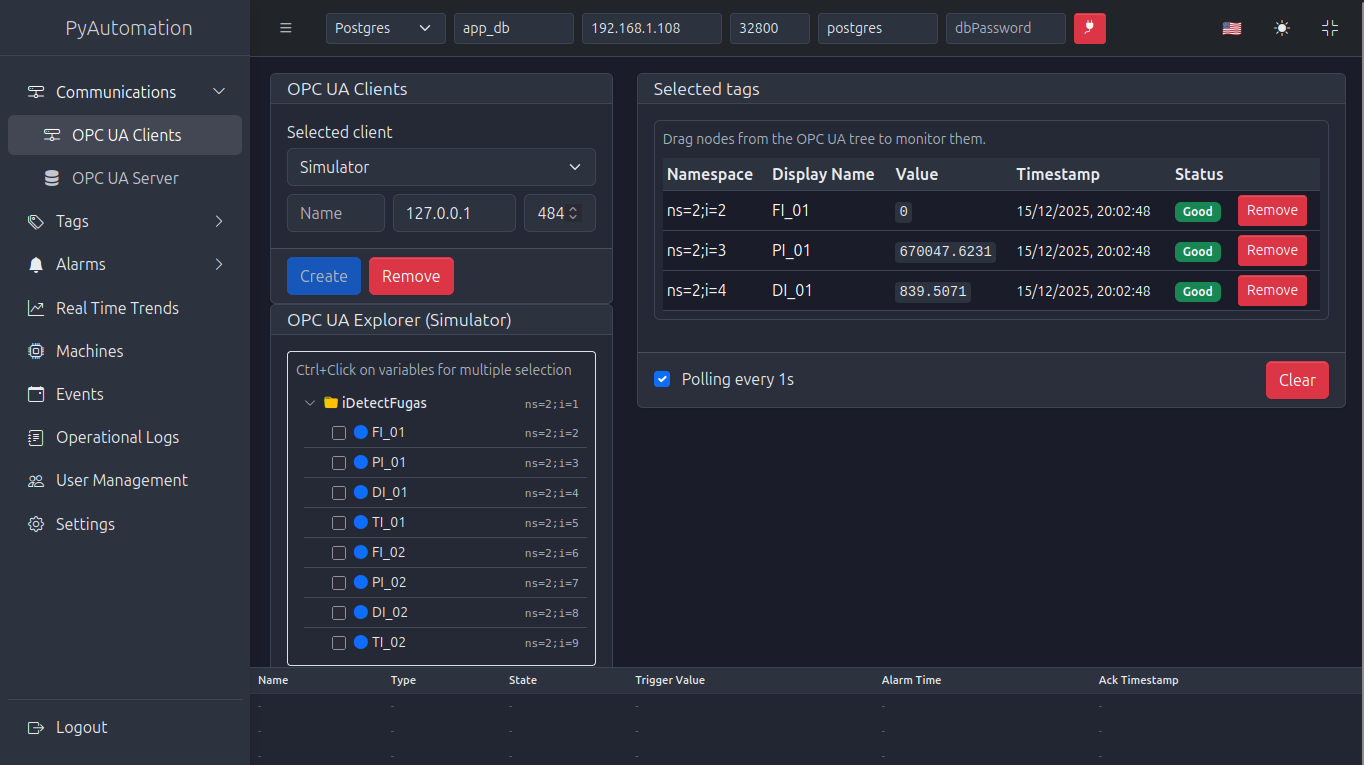
Figure 0: PyAutomation HMI showing OPC UA client connections and database integration
🎯 🐳 1. End-to-End Demo Stack with Docker (DB + OPC UA Simulator + PyAutomation)
🧪 Complete Test Environment
For a complete test environment, the recommended way to run PyAutomation (including the HMI) is to use the provided docker-compose.yml in the project root: PyAutomation provides a docker-compose.yml file that starts:
- A PostgreSQL database (
dbservice). - An OPC UA simulation server (
opcua_server_simulatorservice). - The PyAutomation automation + HMI container (
automationservice).
📝 Configuration File Required
Before deploying the demo stack, you must create a .env file in the same directory as your docker-compose.yml file. This configuration file is essential for both development and production deployments as it contains all the environment variables needed to configure PyAutomation.
Create a .env file in your deployment folder with the following variables (adjust values according to your environment):
AUTOMATION_PORT=8050                  # default 8050
AUTOMATION_VERSION=2.0.3              # default latest
AUTOMATION_OPCUA_SERVER_PORT=53530    # default 53530
AUTOMATION_HMI_PORT=5000
AUTOMATION_APP_SECRET_KEY="12DFW7HJHJWER6W73338343-FEDF94-EF9EF-EFR9ER"
AUTOMATION_SUPERUSER_PASSWORD="super_ultra_secret_password"
AUTOMATION_DB_TYPE=postgresql
AUTOMATION_DB_HOST=xxx.xxx.xxx.xxx    # It's important change for your host ip
AUTOMATION_DB_PORT=5432
AUTOMATION_DB_USER=postgres
AUTOMATION_DB_PASSWORD=postgres
AUTOMATION_DB_NAME=app_db
💡 Important Notes:
- The
.envfile must be in the same directory as yourdocker-compose.ymlfile. - For production deployments, ensure you use secure values for
AUTOMATION_SUPERUSER_PASSWORDandAUTOMATION_APP_SECRET_KEY. - The
AUTOMATION_DB_*variables should match your PostgreSQL database configuration. - Never commit the
.envfile to version control if it contains sensitive information.
This is the fastest way to try PyAutomation with realistic field data, database, and HMI in a single command.
1.1. docker-compose.yml: Services Overview
📥 Download Files: This file (docker-compose.yml) and other required configuration files can be downloaded in section 1.2 below.
The docker-compose.yml file defines three services:
services:

  db:
    container_name: app_db
    image: "postgres:17-bullseye"
    restart: always
    logging:
      driver: "json-file"
      options:
        max-size: "10m"
        max-file: "7"
    ports:
      - ${AUTOMATION_DB_PORT:-5432}:5432
    environment:
      POSTGRES_PASSWORD: ${AUTOMATION_DB_PASSWORD:-postgres}
      POSTGRES_USER: ${AUTOMATION_DB_USER:-postgres}
      POSTGRES_DB: ${AUTOMATION_DB_NAME:-app_db}
    healthcheck:
      test: ["CMD-SHELL", "pg_isready -U postgres"]
      interval: 10s
      timeout: 5s
      retries: 3

  opcua_server_simulator:
    container_name: opcua_server_simulator
    restart: always
    logging:
      driver: "json-file"
      options:
        max-size: "10m"
        max-file: "7"
    image: "knowai/opcua_server_simulator:2.2.1"
    ports:
      - 0.0.0.0:5015:5015
      - 0.0.0.0:4840:4840
    environment:
      - APP_THREADS=5
      - APP_PORT=5015
      - ASYNC_APP=0
    healthcheck:
      test: curl --fail -s -k http://0.0.0.0:5015/api/healthcheck/ || exit 1
      interval: 15s
      timeout: 10s
      retries: 5
    volumes:
      - ./opcua_server_simulator.yml:/app/app/config.yml
      - ./data_for_tests.csv:/app/app/data/data_for_tests.csv

  automation:
    container_name: "Automation"
    image: "knowai/automation:${AUTOMATION_VERSION:-latest}"
    restart: always
    ports:
      # Backend API (Flask/Gunicorn)
      - ${AUTOMATION_PORT:-8050}:${AUTOMATION_PORT:-8050}
      # HMI frontend served by Nginx inside the container (listen 3000)
      - ${AUTOMATION_HMI_PORT:-3000}:3000
    volumes:
      - automation_db:/app/db
      - automation_logs:/app/logs
    logging:
      driver: "json-file"
      options:
        max-size: "10m" # Rota cuando llega a 10MB
        max-file: "3" # Guarda máximo 3 archivos (30MB total)
    environment:
      AUTOMATION_OPCUA_SERVER_PORT: ${AUTOMATION_OPCUA_SERVER_PORT:-53530}
      AUTOMATION_APP_SECRET_KEY: ${AUTOMATION_APP_SECRET_KEY:-073821603fcc483f9afee3f1500782a4}
      AUTOMATION_SUPERUSER_PASSWORD: ${AUTOMATION_SUPERUSER_PASSWORD:-super_ultra_secret_password}
      AUTOMATION_DB_TYPE: ${AUTOMATION_DB_TYPE:-postgresql}
      AUTOMATION_DB_HOST: ${AUTOMATION_DB_HOST:-127.0.0.1}
      AUTOMATION_DB_PORT: ${AUTOMATION_DB_PORT:-5432}
      AUTOMATION_DB_NAME: ${AUTOMATION_DB_NAME:-app_db}
      AUTOMATION_DB_USER: ${AUTOMATION_DB_USER:-postgres}
      AUTOMATION_DB_PASSWORD: ${AUTOMATION_DB_PASSWORD:-postgres}
    tmpfs:
      - /tmp:size=500k
    depends_on:
      db:
        condition: service_healthy
      opcua_server_simulator:
        condition: service_healthy
    deploy:
      resources:
        limits:
          cpus: "0.5"
          memory: 256M
    healthcheck:
      test: ["CMD", "python", "/app/healthcheck.py"]
      interval: 15s
      timeout: 10s
      retries: 3

volumes:
  automation_db:
  automation_logs:
At a glance:
dbexposes PostgreSQL onlocalhost:32800with databaseapp_dband userpostgres.opcua_server_simulatorruns an industrial‑oriented OPC UA simulator with:- HTTP API (
APP_PORT=5015) and healthcheck. - OPC UA endpoint on port
4840. - Configuration and data injected via
opcua_server_simulator.ymlanddata_for_tests.csv. automationis the same PyAutomation service described in section 1, wired to the simulator and DB.
💡 Tip
This stack is ideal for demos, automated tests, and onboarding workshops.
1.2. Download Required Files
To run the demo stack, you need to download the following configuration and data files. Download all files to the same directory to ensure everything works together:
📥 Download All Files
💡 Quick Setup: Create a new folder (e.g., pyautomation-demo), download all three files below to that folder, then follow the deployment instructions in section 1.2.1.
📄 OPC UA Simulator Config
Configuration file for the OPC UA server simulator
Download opcua_server_simulator.yml
Important: All three files must be in the same directory. The docker-compose.yml file references the other two files using relative paths (./opcua_server_simulator.yml and ./data.csv).
1.2.1. Deployment Instructions
Once you have downloaded all three files to the same directory, follow these steps to deploy the complete demo stack:
🚀 Quick Deployment Steps
Step 1: Navigate to your files directory
Step 2: Verify all files are present
ls -la
# You should see:
# - docker-compose.yml
# - opcua_server_simulator.yml
# - data_for_tests.csv
Step 3: Create a .env file
You must create a .env file to customize ports and credentials, or use the default values defined in docker-compose.yml.
AUTOMATION_PORT=8050                  # default 8050
AUTOMATION_VERSION=2.0.3              # default latest
AUTOMATION_OPCUA_SERVER_PORT=53530    # default 53530
AUTOMATION_HMI_PORT=5000
AUTOMATION_APP_SECRET_KEY="12DFW7HJHJWER6W73338343-FEDF94-EF9EF-EFR9ER"
AUTOMATION_SUPERUSER_PASSWORD="super_ultra_secret_password"
AUTOMATION_DB_TYPE=postgresql
AUTOMATION_DB_HOST=xxx.xxx.xxx.xxx    # It's important change for your host ip
AUTOMATION_DB_PORT=5432
AUTOMATION_DB_USER=postgres
AUTOMATION_DB_PASSWORD=postgres
AUTOMATION_DB_NAME=app_db
Step 4: Start the demo stack
Step 5: Check service status
Step 6: View logs
If everything is working correctly, you should see output similar to this:
Automation  | 2025-12-19 00:32:19,939 INFO Set uid to user 0 succeeded
Automation  | 2025-12-19 00:32:19,942 INFO supervisord started with pid 1
Automation  | 2025-12-19 00:32:20,946 INFO spawned: 'nginx' with pid 7
Automation  | 2025-12-19 00:32:20,948 INFO spawned: 'backend' with pid 8
Automation  | 2025-12-19 00:32:22,873 INFO success: nginx entered RUNNING state, process has stayed up for > than 1 seconds (startsecs)
Automation  | 2025-12-19 00:32:31,722 INFO success: backend entered RUNNING state, process has stayed up for > than 10 seconds (startsecs)
Step 7: View backend logs
If everything is working correctly, you should see backend application logs here.
[WARNING] -  Not Found service without SSL Certificate
[OK] - Worker connections: 100
[OK] - Number of workers: 1
[INFO] 2025-12-19 00:48:33 Starting app with configuration:
[INFO] 2025-12-19 00:48:33 Logger period: 10.0 seconds
[INFO] 2025-12-19 00:48:33 Log max bytes: 10485760 bytes
[INFO] 2025-12-19 00:48:33 Log backup count: 3 backups
[INFO] 2025-12-19 00:48:33 Log level: 20
[INFO] 2025-12-19 00:48:34 App started successfully
✅ Once running, access the services:
- PyAutomation HMI:
http://localhost:3000(or the port specified in yourAUTOMATION_HMI_PORTenvironment variable) - PyAutomation API:
http://localhost:8050/api/docs(or the port specified in yourAUTOMATION_PORTenvironment variable) - OPC UA Server:
opc.tcp://localhost:4840 - OPC UA Simulator API:
http://localhost:5015/api/docs
🔐 Superuser Account Created
During the initial startup, PyAutomation automatically creates a superuser account with the following credentials:
- Username:
system - Password: The value configured in your
AUTOMATION_SUPERUSER_PASSWORDenvironment variable (from your.envfile)
You can use these credentials to log in to the PyAutomation HMI at http://localhost:3000 (or your configured HMI port). This superuser account has full administrative privileges and is intended for initial setup, creating additional users, and system recovery.
Security Note: Change the AUTOMATION_SUPERUSER_PASSWORD value in your .env file from the default before deploying to production environments.
1.3. OPC UA Simulator Configuration: opcua_server_simulator.yml
The OPC UA simulator uses a YAML configuration file mounted into the container:
version: "3.3"

filename: "data_for_tests"
separator: ","
header: [0]
interval: 1.0
variables:
  FI_01:
    name: "FIRST_TRANSMITTER_MASS_FLOW"
    uncertainty: 0.1
    min: 0
    max: 200
  PI_01:
    name: "FIRST_TRANSMITTER_PRESSURE"
    uncertainty: 0.1
    min: 200000
    max: 1200000
  # ... other variables ...
server_folder_namespace: iDetectFugas
Key fields:
filename: base name of the CSV file without extension. Here it isdata_for_tests, which matchesdata_for_tests.csv.separator: column separator used in the CSV file (,in this case).header: [0]: indicates that the first row (index 0) in the CSV contains column headers.interval: time in seconds between updates (e.g.,1.0means new values every 1 second).variables: dictionary of OPC UA variables the simulator will expose:- Keys like
FI_01,PI_01, etc. map to tags/nodes. name: human‑readable description.min,max: value ranges used to generate or normalize data.uncertainty: percentage uncertainty / noise to apply.server_folder_namespace: top‑level namespace folder under which the variables appear in the OPC UA address space.
The simulator uses this configuration plus the CSV file to drive the time series it serves.
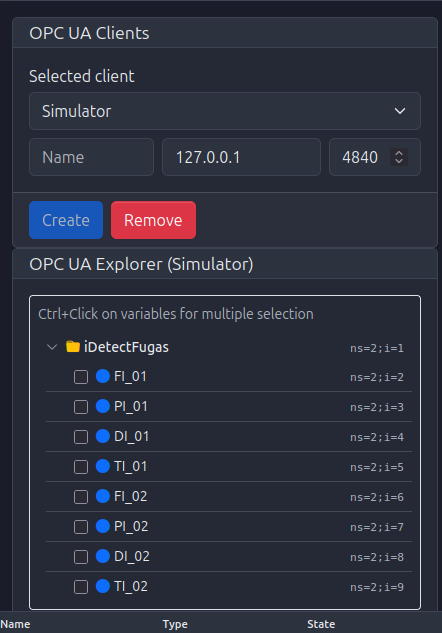
Figure 3.2: OPC UA namespace tree showing variables like FI_01, PI_01, etc. from the simulator
1.4. CSV Data Format: data_for_tests.csv
The data_for_tests.csv file (mounted into the container) provides the raw time‑series used by the simulator:
- Must be located in the project root (as referenced in
docker-compose.yml). - Is mounted to
/app/app/data/data_for_tests.csvinside the container. - Must match the
filenamespecified inopcua_server_simulator.yml(data_for_tests→data_for_tests.csv).
General format:
- Separator: comma (
,), as specified byseparator: ",". - Header row (row 0): contains column names that the simulator uses to map data.
- Data rows: each row represents one time step.
- Numeric columns are interpreted according to the
variablessection inopcua_server_simulator.yml.
Conceptually:
timestamp,FI_01,PI_01,DI_01,TI_01,FI_02,PI_02,DI_02,TI_02
2024-01-01T00:00:00Z, 10.0, 250000, 800, 20, 15.0, 260000, 820, 21
2024-01-01T00:00:01Z, 11.2, 252000, 805, 20.1, 15.5, 262000, 825, 21.1
...
The actual
data_for_tests.csvin the repository may contain different columns and values, but it follows this pattern: a header line plus numerical data compatible with the variables defined inopcua_server_simulator.yml.
If you want to customize the simulation:
- Edit
opcua_server_simulator.ymlto add/remove variables or change ranges. - Adjust
data_for_tests.csvso that: - It contains corresponding columns for your variables.
- Values fall within the desired ranges.
Note: The
data_for_tests.csvfile follows a standard CSV format with a header row and numeric data columns. You can open it in any spreadsheet application (Excel, LibreOffice Calc, etc.) to view and edit the time-series data.
1.5. Starting the full demo stack
Once you run your command:
This will:
- Start PostgreSQL (
db). - Start the OPC UA simulator (
opcua_server_simulator). - Start PyAutomation (
automation) using the same image and environment variables described earlier.
Once all three services are healthy:
- Access the HMI at
http://localhost:${AUTOMATION_HMI_PORT:-3000}(for examplehttp://localhost:3000orhttp://localhost:5000depending on your.env). - Configure the Database connection in the HMI to point to the
dbservice: - Host:
db(inside Docker network) orlocalhost:32800from the host, depending on your setup. - Port:
5432. - Database:
app_db. - User / Password:
postgres/postgres(or your custom values). - Configure an OPC UA Client in the HMI to point to the simulator:
- Endpoint:
opc.tcp://opcua_server_simulator:4840(inside Docker network) oropc.tcp://localhost:4840from the host.
From this point, you have a realistic test environment with:
- A running database.
- A configurable OPC UA simulator serving data from a CSV file.
- PyAutomation HMI ready to define tags, trends, alarms, and real‑time charts based on that data.
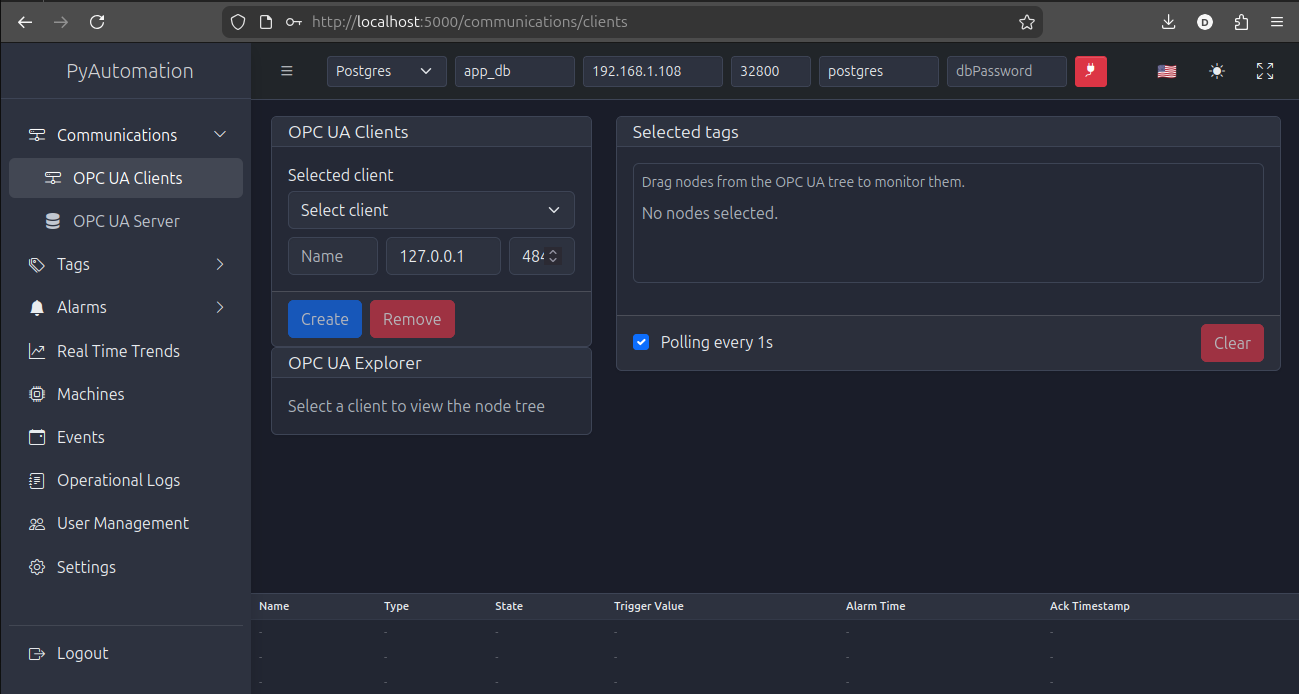
Figure 34: Main dashboard after successful login, showing the HMI connected to database and ready for configuration
🖥️ 4. First Steps in the HMI
🎨 Getting Started with the Interface
Once the containers are running, open the HMI in your browser.
4.1. Creating the first user (Signup flow)
User accounts are created from the Login/Signup screen.
- Open the HMI login page (e.g.,
http://localhost:8050). - Click on the Signup option on the login screen.
- Fill in the signup form:
- Username
- Password
- Optional: Name and Last name
- Submit the form. A new user will be created automatically with the lowest permission level (GUEST / invited user).
At this stage, the new user can log in but has limited permissions. To promote this user to an operator or admin:
- Log in using the superuser credentials (controlled by
AUTOMATION_SUPERUSER_PASSWORD). - Navigate to User Management / Users.
- Locate the newly created GUEST user.
- Change the role to the appropriate level (e.g., admin for the first full‑privilege account).
- Log out and log back in with the promoted user.
From this point, you should use admin and operator accounts for daily work, and reserve the superuser only for recovery procedures and role management when no admin is available.
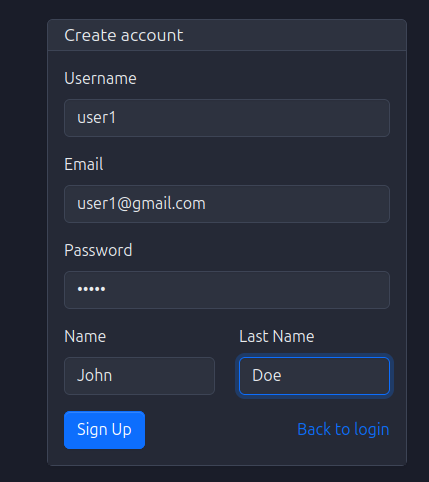
Figure 2: User signup form for creating new accounts
4.2. User login
- Access the login page at
http://localhost:8050. - Enter username/email and password.
- If login fails, check:
- Container logs.
- That the user is active and has a valid role assigned.
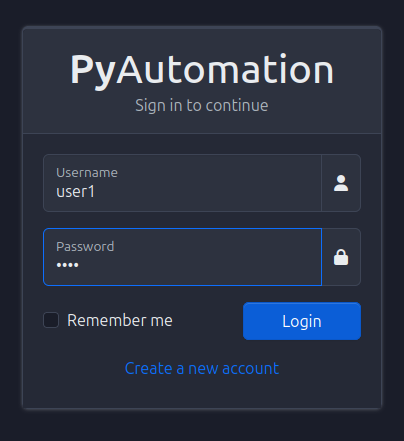
Figure 3: Login page with username/password fields
5. Navbar Basics: Language, Theme, Fullscreen
The top navigation bar (navbar) provides quick access to global UI features:
- Language switch: Change the UI language (e.g., English / Spanish).
- Theme toggle: Switch between light and dark themes.
- Fullscreen: Enter / exit fullscreen mode for control room displays.
These settings are purely visual but essential for a comfortable operator experience.
Steps:
- Locate the language selector and choose your preferred locale.
- Toggle the theme icon to switch between light and dark modes.
- Use the fullscreen button when deploying on wall screens or operator stations.
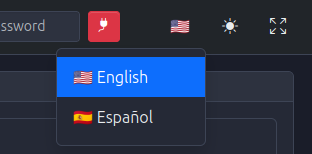
Figure 4: Navbar with language switch, theme toggle, and fullscreen controls
6. Connecting to the Database from the HMI
With PostgreSQL running, connect PyAutomation to the database via the HMI:
- Open the Database section from the navbar.
- Fill in:
- Host (e.g.,
localhostorpostgresif using Docker network). - Port (e.g.,
5432). - Database name (e.g.,
automation_db). - User and Password (e.g.,
automation_user/your_password). - Click Connect.
On success:
- PyAutomation will create all required tables (tags, alarms, users, events, logs, etc.).
- Initial default data (roles, variables, units) will be inserted.
If connection fails, check:
- That the DB container is running and reachable.
- Credentials and DB name.
- Docker network configuration (if using multiple containers).

Figure 5: Database configuration form in the navbar
7. Defining an OPC UA Client (Field Data Connectivity)
To bring real (or simulated) field data into PyAutomation:
- Go to the Communications / OPC UA Clients section.
- Create a new OPC UA client:
- Name: A descriptive identifier (e.g.,
Plant_Simulator). - Endpoint URL: e.g.,
opc.tcp://opcua-sim:4840/oropc.tcp://localhost:4840/. - Security mode / policy as appropriate (for a simulator, often
None). - Save the client and establish the connection.
- Use the OPC UA browser to:
- Navigate the node tree.
- Select variables to monitor.
- Add them as tags into the system (see next section).
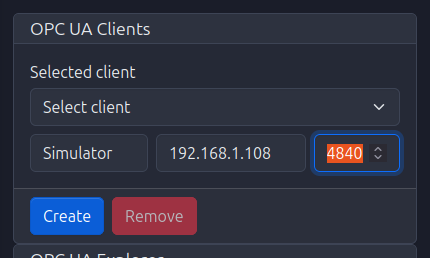
Figure 6: OPC UA client connections management
Figure 7: OPC UA node explorer for browsing the address space
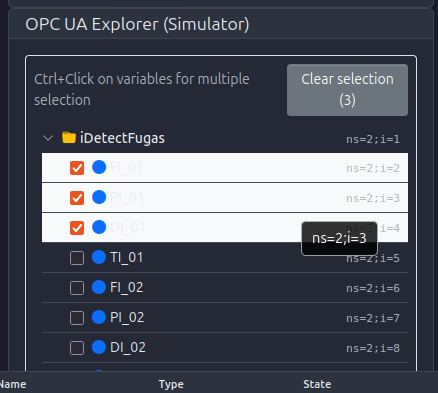
Figure 8: Multi-selection of OPC UA nodes using Ctrl+Click
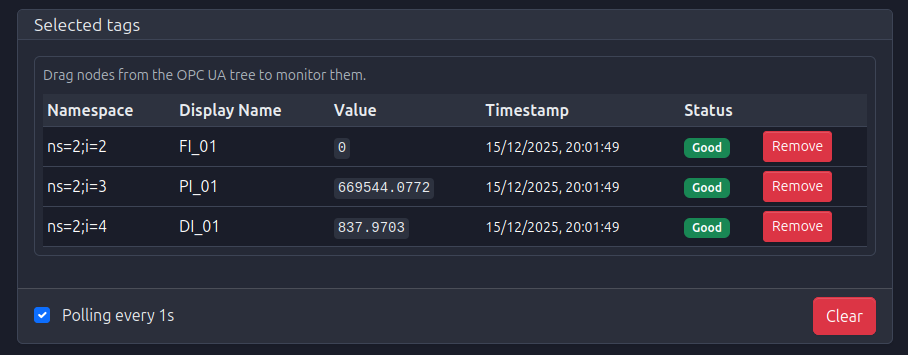
Figure 9: Selected tags in OPC UA explorer with active polling connection
8. Tags: Create, Edit, Delete, Export
Tags are the core data points of PyAutomation.
8.1. Creating tags
- Navigate to the Tags section.
- Click Create (or equivalent action).
- For each tag, define:
- Name: Unique identifier.
- Variable / Data type / Unit: Semantic and type information.
- OPC UA address (if linked to a field variable).
- Scan time, deadband, and other filters as needed.
- Save and verify that live values appear (if connected to OPC UA).
8.2. Editing and deleting tags
- Use the Edit action to adjust parameters like units, descriptions, or OPC UA bindings.
- Use the Delete action to remove unused tags (be aware of dependent alarms, trends, and loggers).
8.3. Exporting / importing tags
- Use the Export function to download tag definitions (for backup or replication).
- Use Import to load predefined tag sets in bulk.
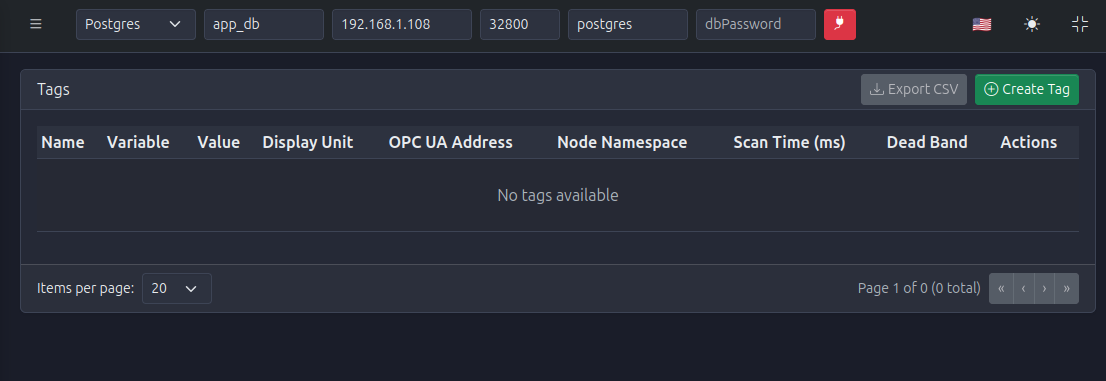
Figure 10: Tags definition page (empty state)
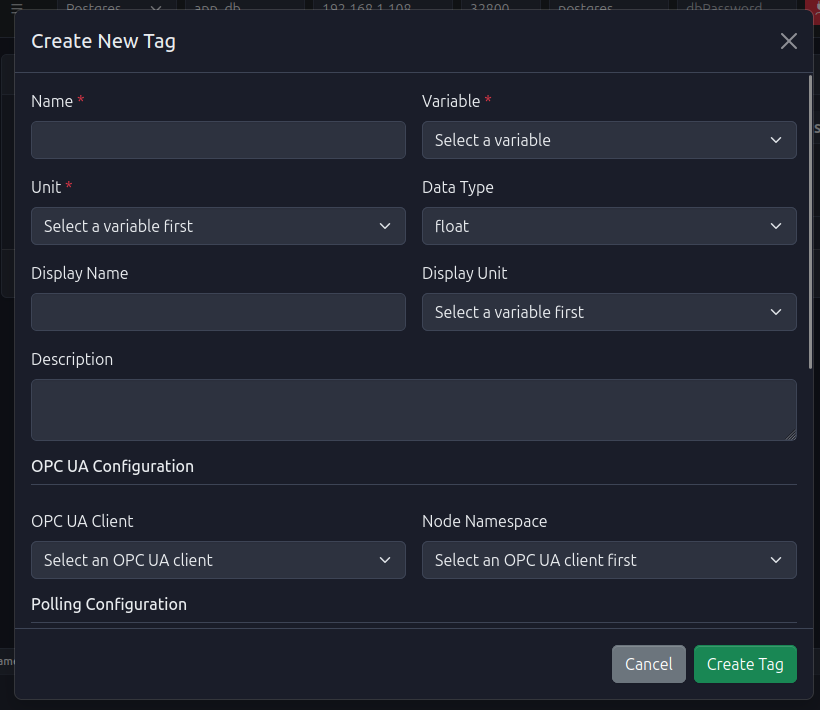
Figure 11: Create new tag form with basic configuration
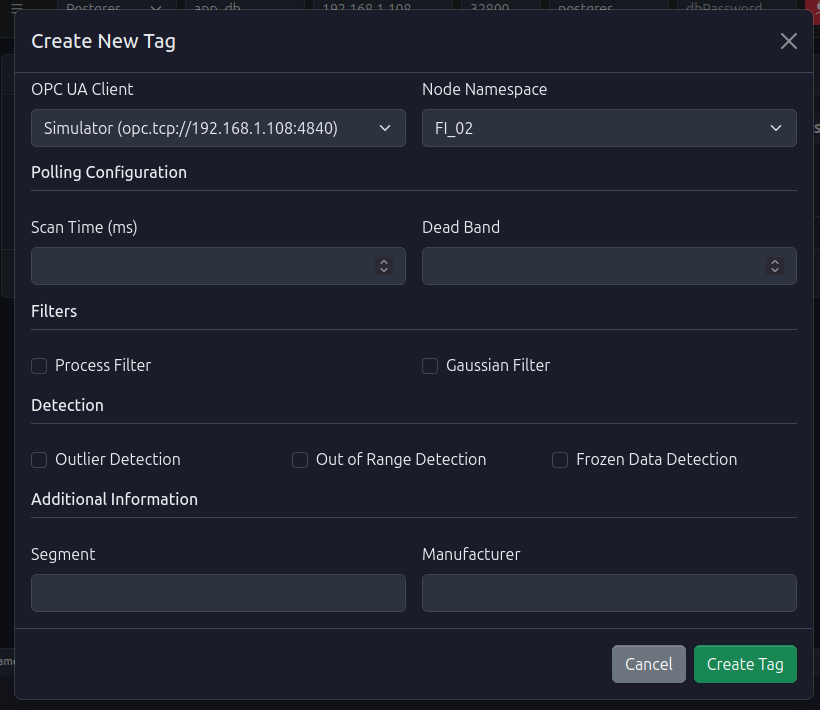
Figure 12: Tag creation form showing polling and filter configuration options
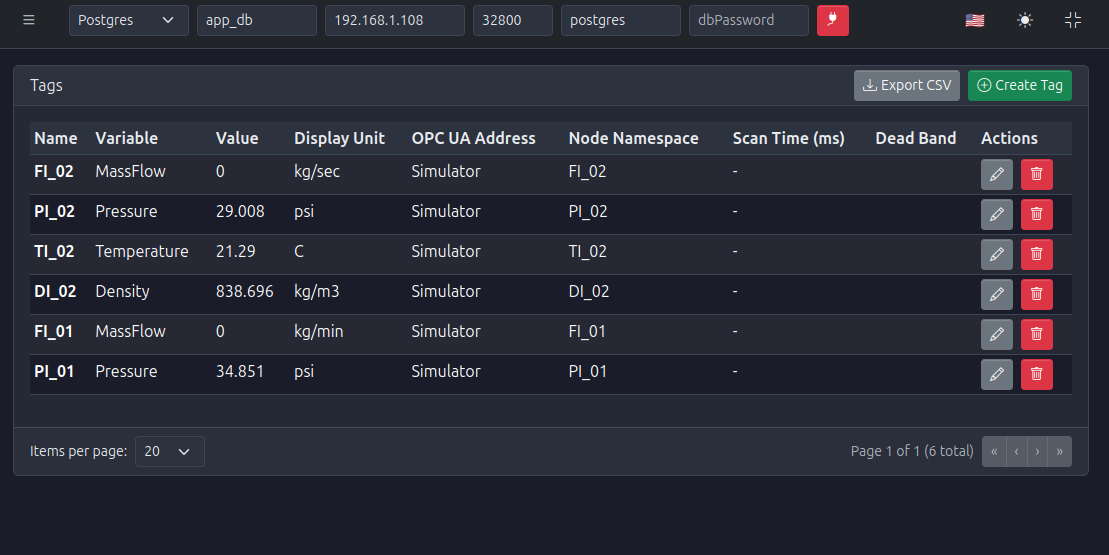
Figure 13: Tags list after creating multiple tags
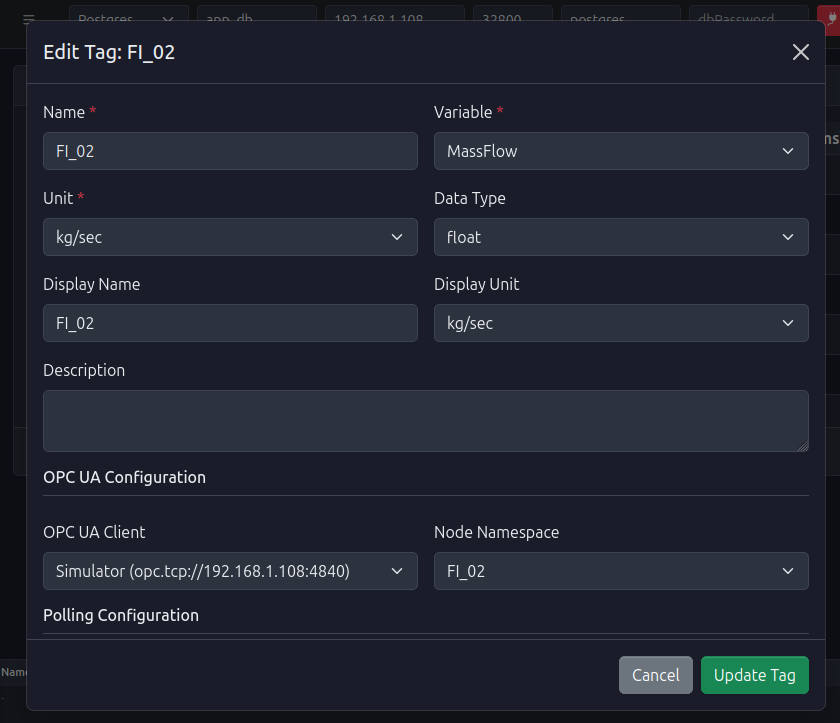
Figure 14: Edit tag form for modifying existing tag parameters
9. DataLogger (Historical Data): Filters and Downloads
The DataLogger module stores tag values for long‑term analysis.
- Open the Data Logger / Historical Data section.
- Configure:
- Tags to log.
- Logging period (sample time).
- Filters (time ranges, tag subsets).
- Once historical data is available, use the UI to:
- Filter by date/time window.
- Select specific tags.
- Download data as CSV/Excel for offline analysis.
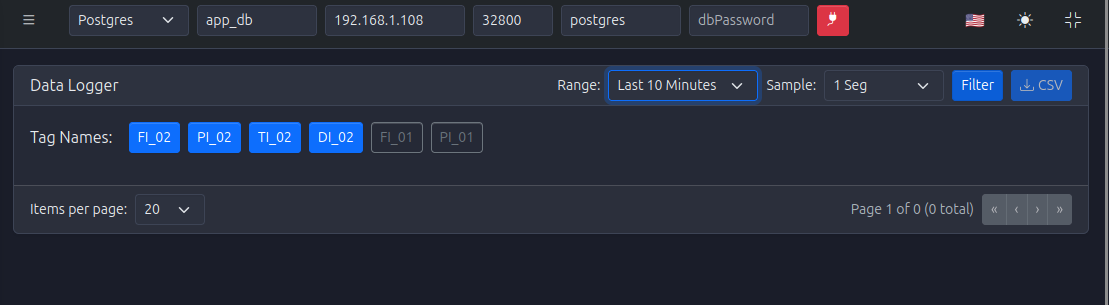
Figure 15: DataLogger empty state with no historical data
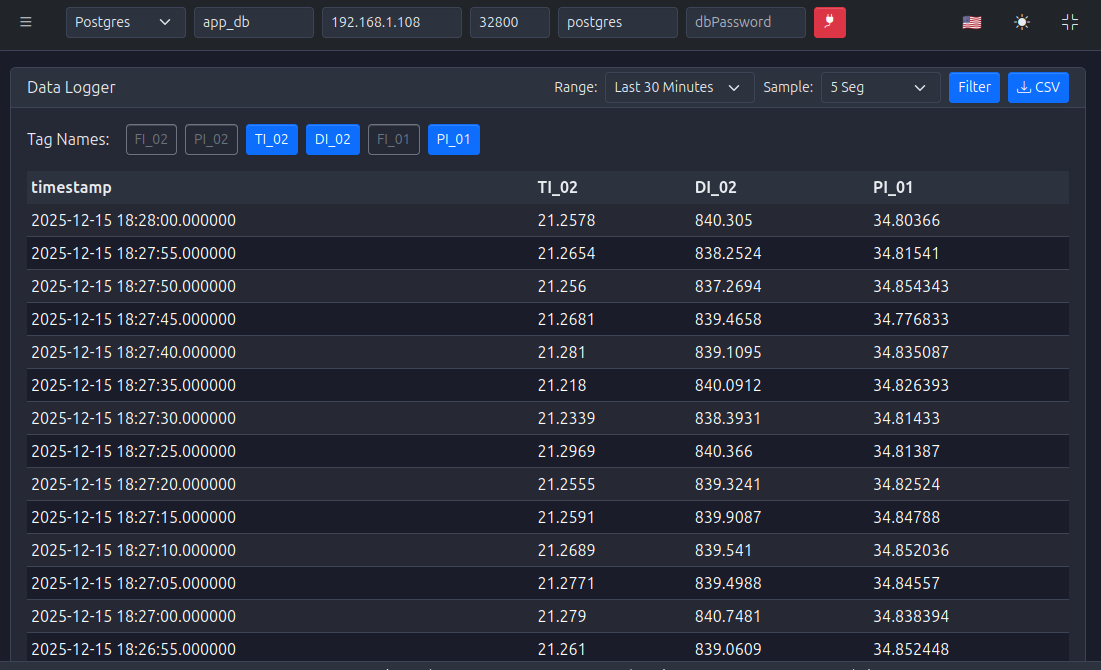
Figure 16: DataLogger with filters applied (5-second sample time)
10. Historical Trends (Trends Module)
Historical trends provide graphical visualization of logged data.
- Go to the Trends section.
- Select:
- One or more tags.
- Time range.
- Sampling and resampling options (if available).
- View the plotted trends and adjust:
- Time window.
- Zoom, pan, and cursors (if supported).
- Export underlying data if needed.
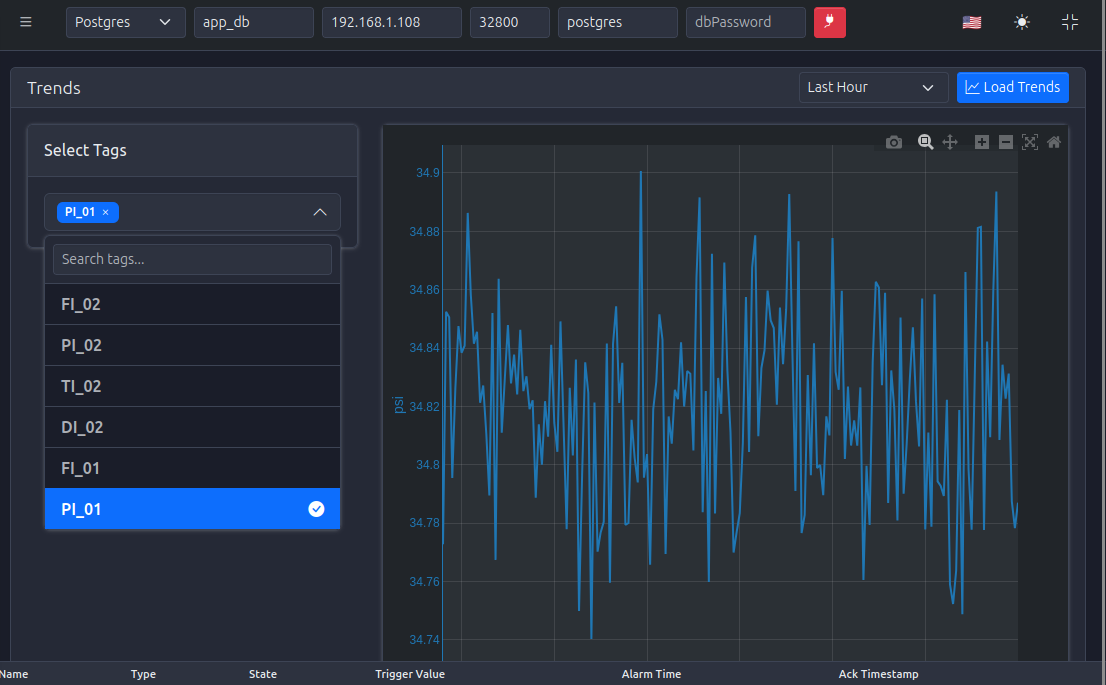
Figure 17: Historical trends chart showing multiple tags over the last hour
11. Alarms: Create, Edit, Delete, Actions, Export
The Alarms module manages process conditions and notifications.
11.1. Defining alarms
- Open the Alarms section.
- Create a new alarm:
- Tag: The process variable to monitor.
- Condition: Threshold (e.g., high, high‑high, low, low‑low).
- Classification / Priority / Severity.
- Messages and optional metadata.
- Save and test by driving the source tag beyond thresholds.
11.2. Managing alarms at runtime
- Acknowledge alarms.
- Shelve / suppress alarms (if supported) for maintenance.
- Use filters to focus on active, unacknowledged, or historical alarms.
- Export alarm tables to CSV/Excel for reports and audits.
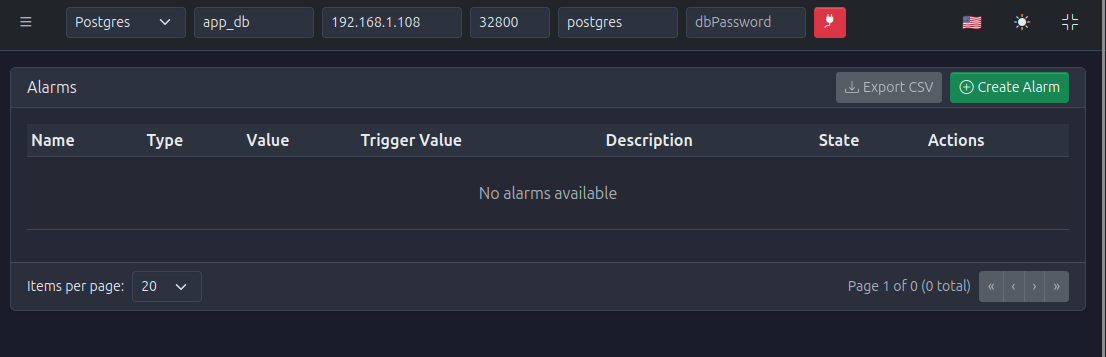
Figure 18: Alarm definition page (empty state)
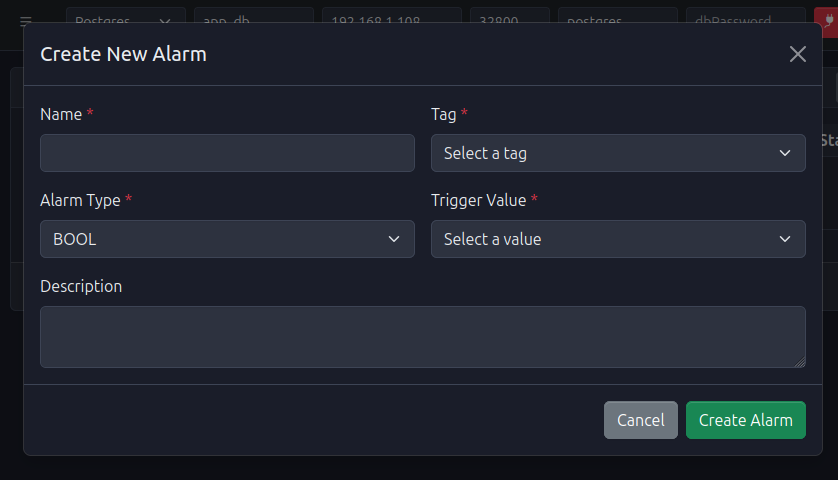
Figure 19: Create new alarm form with tag selection and threshold configuration
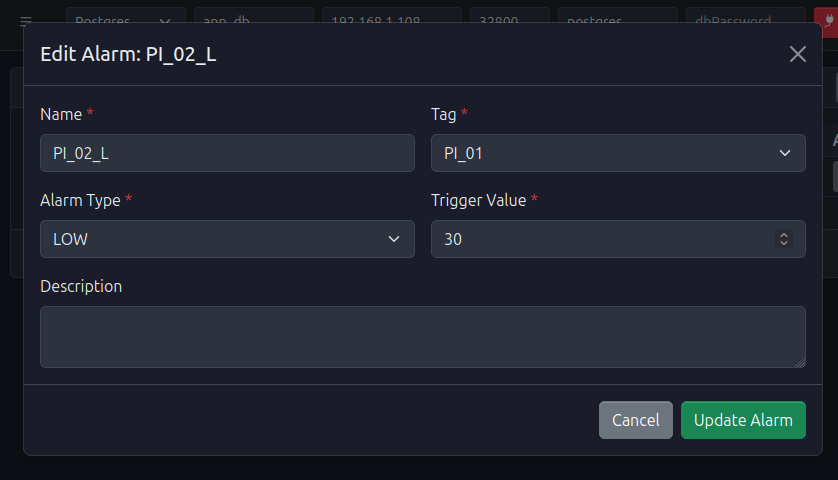
Figure 20: Edit alarm form for modifying alarm parameters
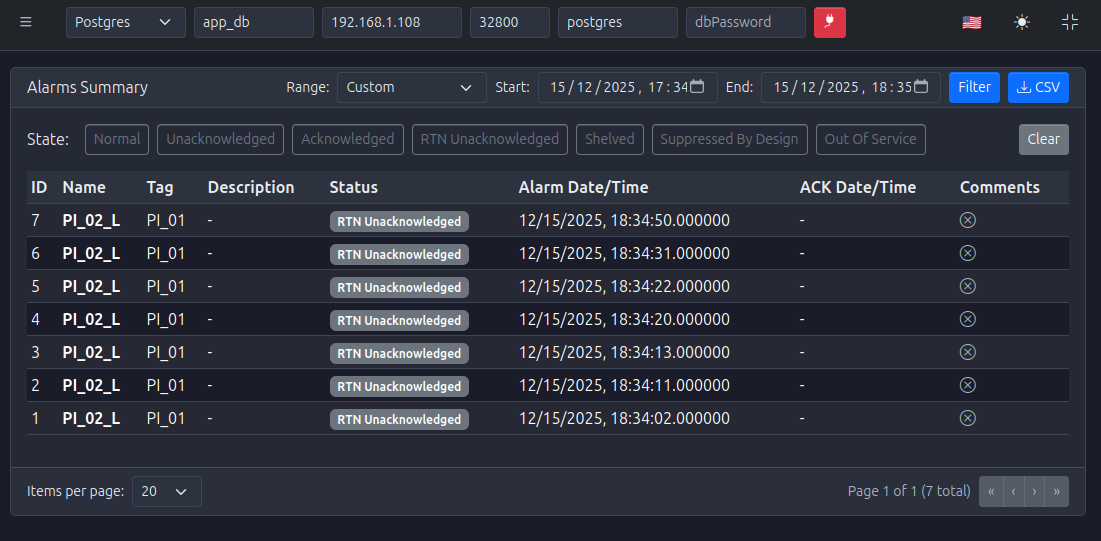
Figure 21: Alarm history page showing active and historical alarms
12. Alarm Summary
The Alarm Summary view aggregates alarm information for quick situational awareness.
Key capabilities:
- Filter by:
- Time window.
- Classification / Priority.
- State (active, acknowledged, cleared).
- Use this view to:
- Identify recurring issues.
- Evaluate alarm flood situations.
- Support root cause analysis.
Figure 22: Alarm summary view with filters and aggregated alarm information
13. Real-Time Trends (HMI Strip Charts)
Real‑time trends (strip charts) are provided by the new HMI module.
13.1. Main features
- Edit / Production modes:
- Edit mode: Reposition and resize strip charts, configure tags and buffer sizes.
- Production mode: Layout is locked; only visualization is available.
- Mode switching by double‑clicking anywhere in the RealTimeTrends view.
- Buffer size:
- Each chart has a configurable buffer size (number of points kept in memory).
- Larger buffers show longer histories but require more memory.
- Tag configuration:
- Each chart supports multiple tags.
- Tags can be grouped by units; up to two distinct units per chart (mapped to two Y‑axes).
13.2. Configuring real‑time trends
- Enter Edit mode (double‑click in the view).
- Click Add Chart to create a new strip chart.
- For each chart:
- Set a descriptive title.
- Use the Tags button to:
- Search tags.
- Add / remove tags.
- Adjust buffer size.
- Drag and resize the charts to build your HMI layout.
- Switch back to Production mode (double‑click) to lock the layout.
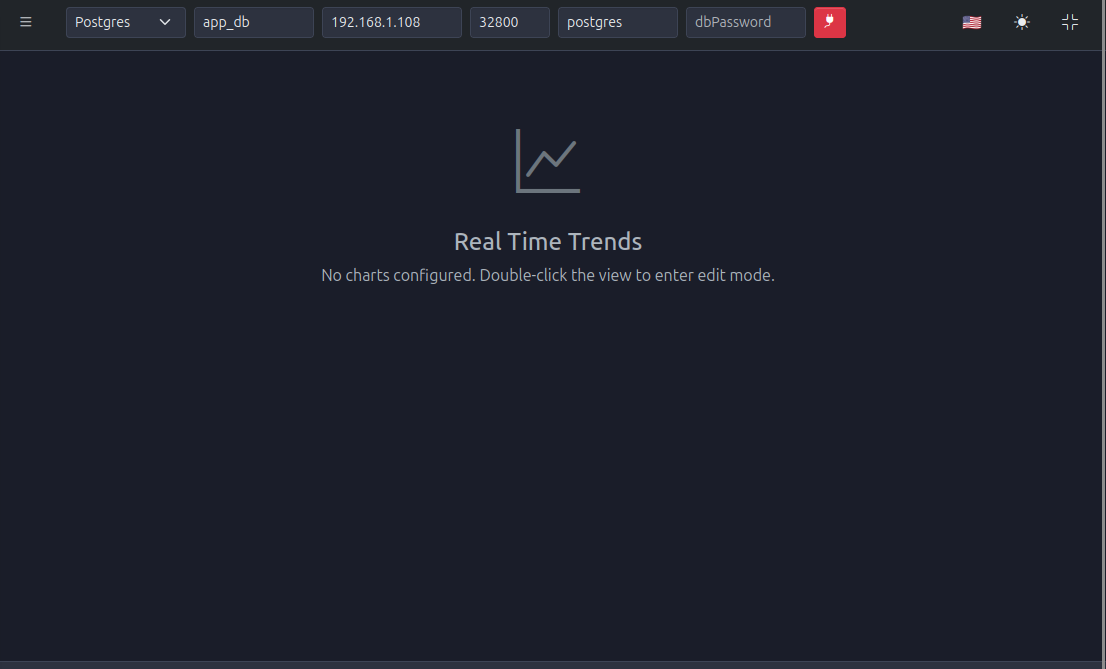
Figure 23: Real-time trends page (empty state)
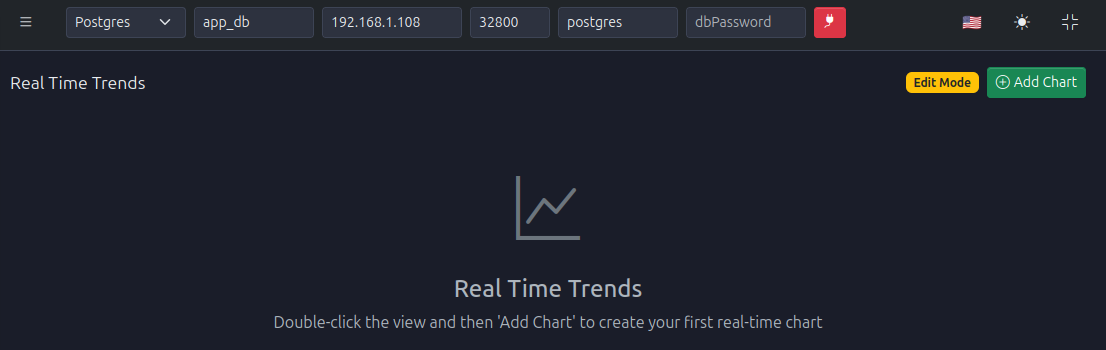
Figure 24: Real-time trends in edit mode for configuring strip charts
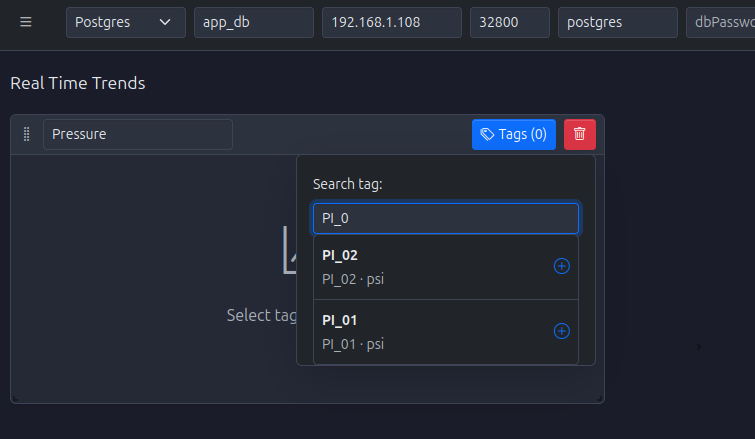
Figure 25: Searching and selecting tags for strip chart configuration
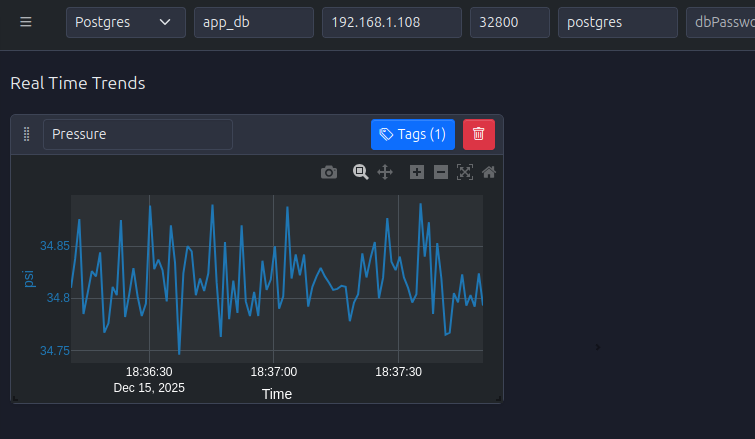
Figure 26: First strip chart configured with selected tags
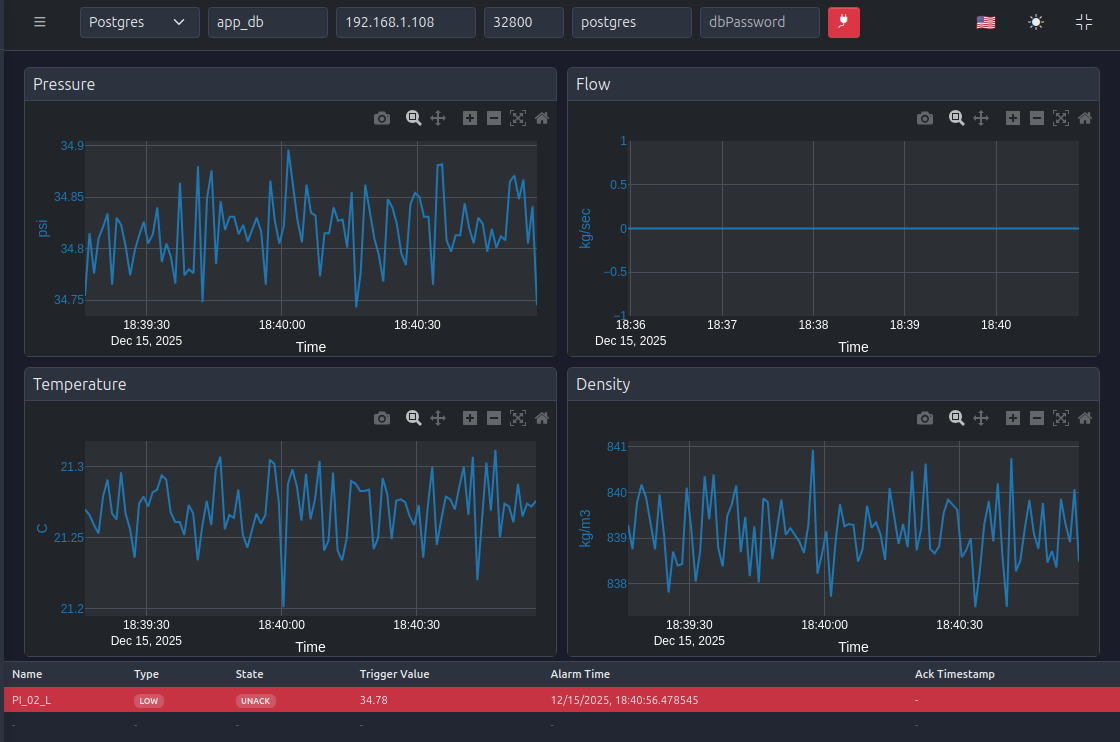
Figure 27: Real-time trends in production mode with multiple strip charts displaying live data
14. Machines: Actions, Configuration, Export
The Machines module (if enabled in your deployment) models equipment or units in your plant.
Typical operations:
- Configure machine metadata (name, description, associated tags).
- View machine status and KPIs.
- Export machine lists and configurations for documentation or replication.
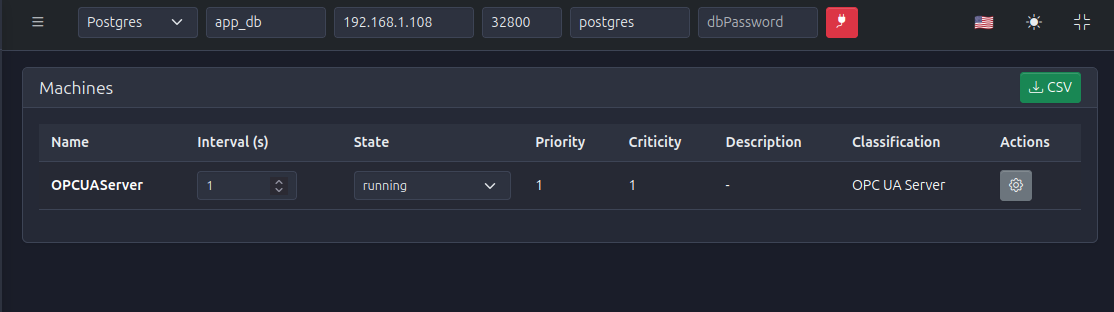
Figure 28: Machines page showing state machine configurations and status
15. Events: Logging, Filters, Comments, Export
PyAutomation logs system and process events to support traceability and diagnostics.
Capabilities:
- What is logged:
- Alarm state changes.
- User actions (logins, configuration changes).
- System events (database connection, communication changes).
- Filters:
- Time range, event type, user, severity.
- Comments:
- Operators can attach comments to events for context and hand‑over.
- Export:
- Download event tables to CSV/Excel for audits and incident analysis.
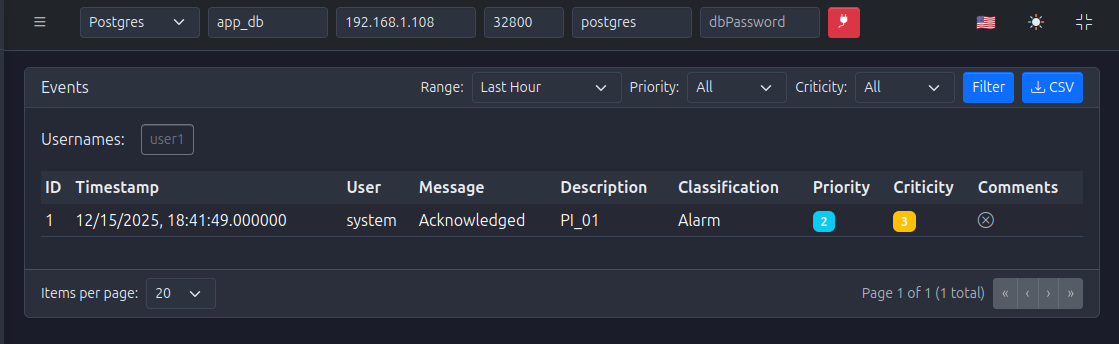
Figure 29: Events page with filters and event history table
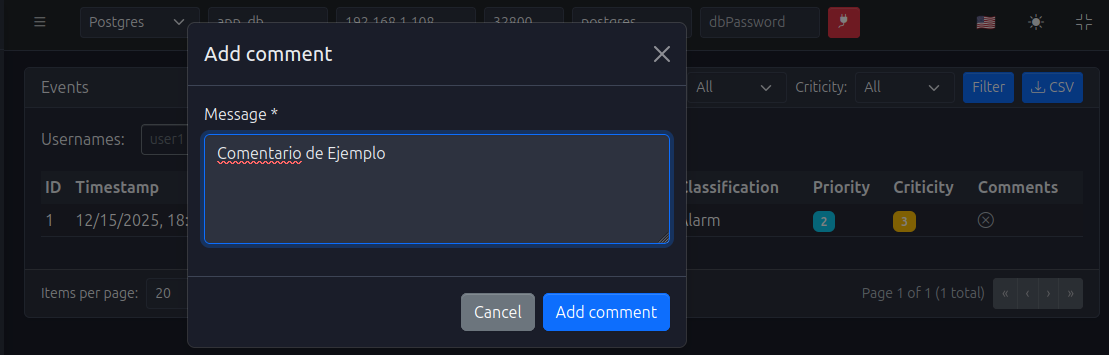
Figure 30: Adding a comment to an event for context and hand-over
16. Operational Logbook (Operational Logs)
The Operational Logbook is used to capture high‑level operational information (beyond raw events and alarms).
Use cases:
- Operator notes during shifts.
- Records of manual interventions.
- Summaries of production issues and resolutions.
Features:
- Classification of logs (e.g., maintenance, operations, quality). +- Advanced filters by date, classification, user.
- Exports for monthly / quarterly reporting.
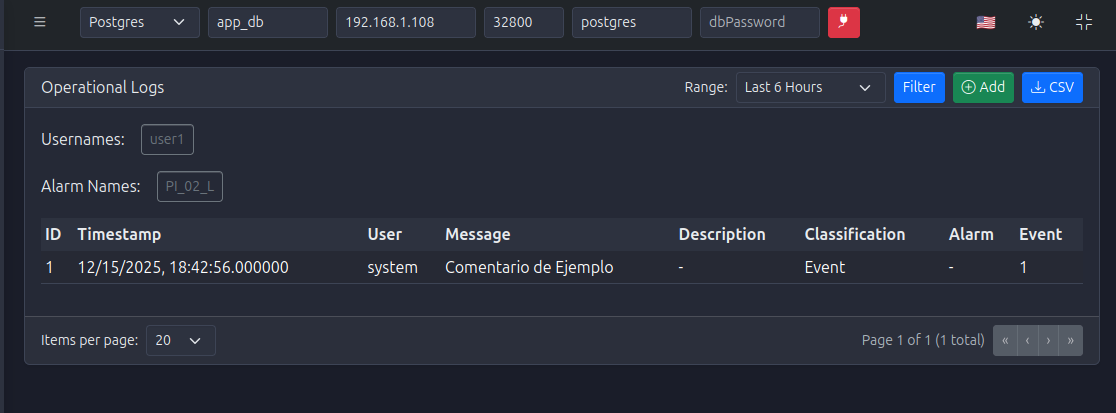
Figure 31: Operational logbook view with classification filters and log entries
17. User Management: Roles, Passwords, Administration
The Users module provides robust access control.
17.1. Roles and permissions
- Default roles (e.g., admin, operator, viewer) define what each user can do.
- Best practice:
- Give admins full configuration rights.
- Give operators runtime control and acknowledgment permissions.
- Give viewers read‑only access.
17.2. Password management
- Admins can:
- Reset user passwords.
- Force password changes at next login (if configured).
- Users can:
- Change their own passwords from the profile or user settings.
17.3. Superuser and recovery
- The superuser password is controlled by
AUTOMATION_SUPERUSER_PASSWORD(see section 1.1). - Use it only for:
- Creating initial admin users.
- Recovering from a state where no admin can log in.
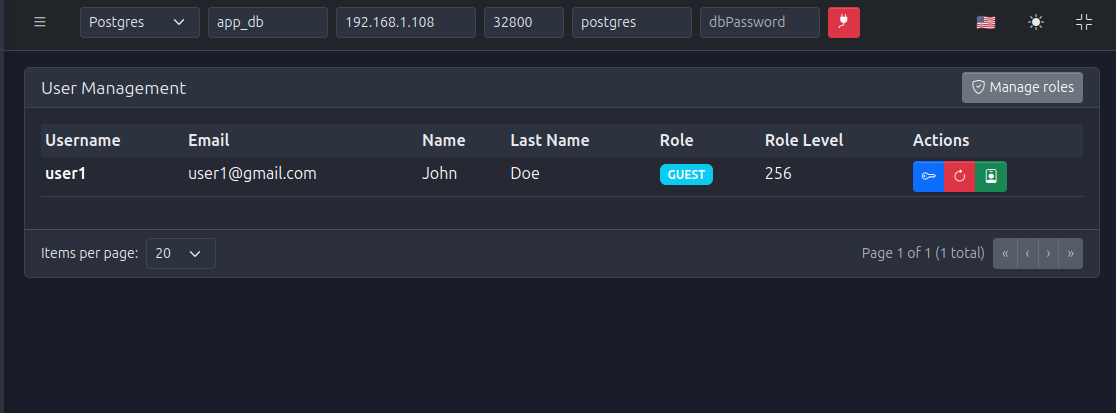
Figure 32: User management page showing user list, roles, and password management actions
18. System Settings: Logger and Configuration Management
The Settings module centralizes system‑level configuration.
Key parameters:
- Logger Period: Interval at which log records are flushed or rotated.
- Log Level: Verbosity (DEBUG, INFO, WARNING, ERROR, CRITICAL).
- Log Max Bytes: Maximum size of a single log file before rotation.
- Log Backup Count: Number of rotated log files to keep.
Configuration management:
- Export Configuration:
- Download a JSON snapshot of system configuration (tags, alarms, communications, users, etc.).
- Useful for backups and cloning environments.
- Import Configuration:
- Load a previously exported configuration.
- Ideal for restoring environments or deploying standardized setups.
Best practices:
- Keep a versioned archive of configuration exports.
- Align log levels with environment:
DEBUGfor development.INFOorWARNINGfor production.
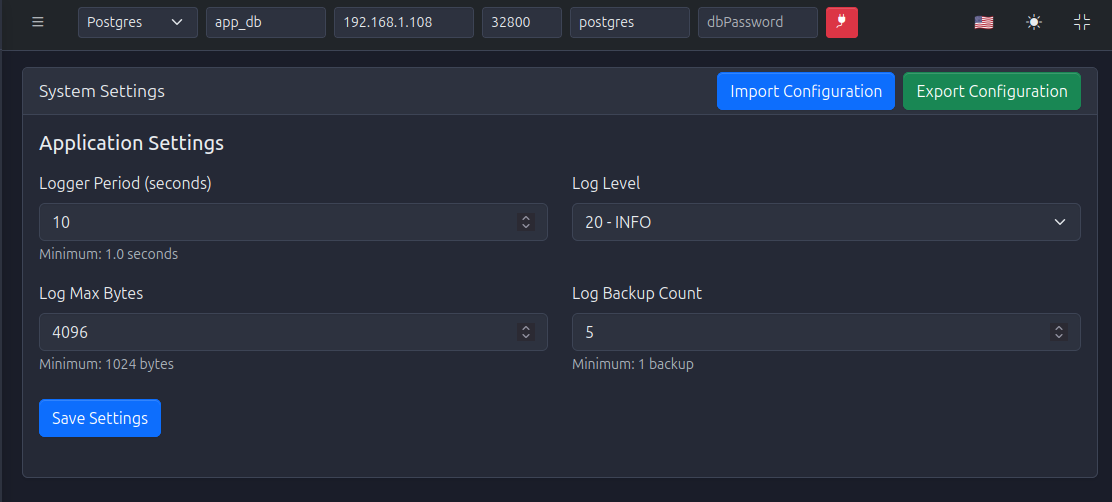
Figure 33: System settings page with logger parameters and configuration import/export options
✅ 19. Summary
🎉 Congratulations! You're Ready to Go
By following this Quick Start, you should now have:
🐳 PyAutomation Running
Backend + HMI running in Docker
💾 Database Connected
PostgreSQL connected and initialized
🔌 OPC UA Simulator
Providing realistic test data
⚙️ Full Configuration
Users, tags, alarms, trends, and logs configured
From here, you can refine your configuration, connect to real plant equipment, and tailor the HMI to your operations.