Trending and Visualization
📈 Visualize Your Data
The Trends feature provides a visual representation of tag data over time. This tool is essential for analyzing process behavior, identifying anomalies, and verifying the performance of connected devices.
📊 Overview
The Trends interface displays a time-series graph for selected tags. It is particularly useful for:
- Monitoring: Real-time observation of critical process variables.
- Analysis: Historical review of data to identify patterns or faults.
- Verification: Checking the stability and responsiveness of OPC UA inputs.
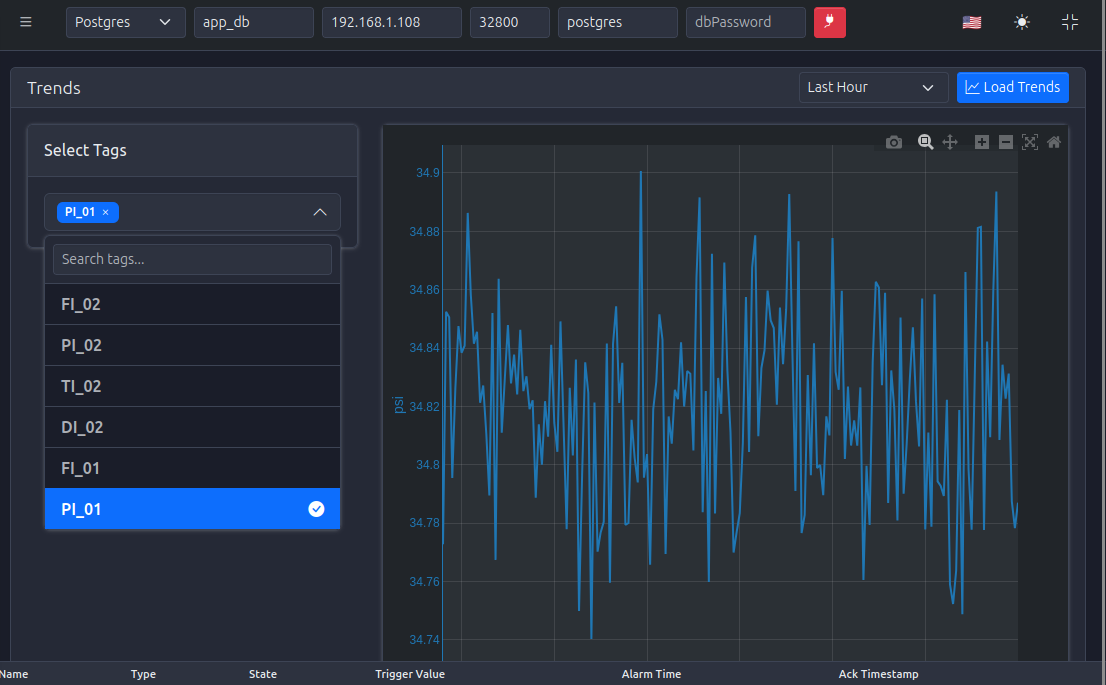
🎯 Usage
1️⃣ Select Tags
Choose the tags you wish to visualize from the selection menu
2️⃣ Define Time Range
Set the time interval for the graph (e.g., last hour, last 24 hours)
3️⃣ Analyze
Interact with the graph to zoom in on specific events or hover over data points for precise values